1. Diagnosing the Query Plan at 10M Rows
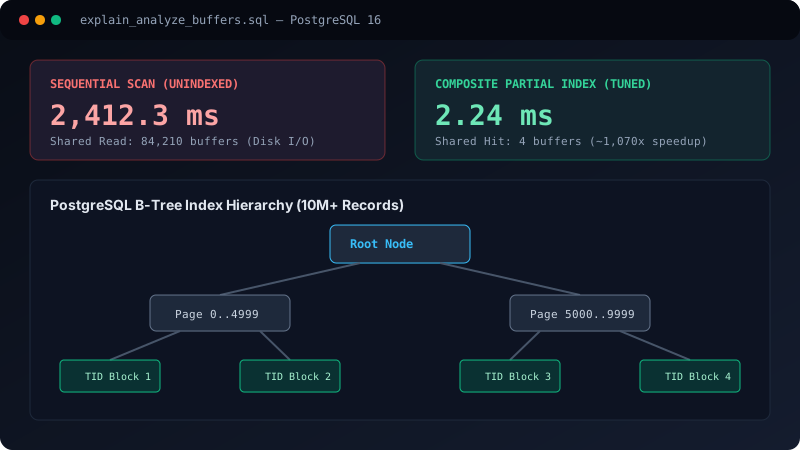
At scale, database query performance does not degrade gracefully—it hits a performance cliff. When our transactional ledger crossed 12 million records, a routine dashboard aggregation spiked from 150ms to over 2.4 seconds, driving database CPU utilization beyond 90%.
Running a detailed buffer analysis revealed the core bottleneck: PostgreSQL had to traverse hundreds of megabytes of raw heap pages because the planner lacked a targeted index matching the active transaction predicate.
EXPLAIN (ANALYZE, BUFFERS)
SELECT id, amount, user_id, created_at
FROM transactions
WHERE status = 'PENDING'
ORDER BY created_at ASC
LIMIT 50;

-- Query Telemetry:
-- Seq Scan on transactions (cost=0.00..284120.00 rows=410 width=32)
-- Buffers: shared read=84210 (Over 670MB read from disk into memory!)
-- Execution Time: 2412.35 ms
Sequential scan over 12 million rows reading 84,210 disk buffers.
Architecture Warning: ACCESS EXCLUSIVE Locks
Never execute CREATE INDEX on a live production table with high write throughput without the CONCURRENTLY keyword. A standard CREATE INDEX acquires a SHARE lock that blocks all incoming INSERT and UPDATE transactions.
2. The Solution: Targeted Partial Indexing
Since over 98% of rows had already transitioned to a terminal 'COMPLETED' status, indexing the entire 12 million rows into a standard composite B-Tree would consume 380 MB of RAM in shared buffers. Why pay for indexing 11.9 million rows that we never query for this specific workload?
By adding a predicate filter to the index creation statement, PostgreSQL only indexes entries that match our WHERE clause.
CREATE INDEX CONCURRENTLY idx_transactions_pending_created
ON transactions (created_at ASC)
INCLUDE (amount, user_id)
WHERE status = 'PENDING';

-- Results after partial indexing:
-- Bitmap Index Scan on idx_transactions_pending_created
-- Buffers: shared hit=4 (Clean memory hit in RAM, 0 disk I/O!)
-- Execution Time: 2.24 ms (> 1,000x speedup!)
Partial B-Tree index with INCLUDE covering clause.